-
-
solar71.JPG
This is two hour period I'm concerned about.
Would the M-250's have eliminated this plateau ???Comment
-
Enphase first rated M215 support up to 260W panel, but in 2014, they raise up to 270W.Comment
-
You have panel level data, right? Check and see what the individual panels were putting out at that time. It kind of looks like some panels were clipping and maybe some not, going to M250's might have helped round it out. The amount of energy getting shaved off there is very low.CS6P-260P/SE3000 - http://tiny.cc/ed5ozxComment
-
And back then M250 was rated at up to 300W DC input. http://pdf.wholesalesolar.com/invert...146.1426919041 Now it's 310W.
My guess is that they don't want to lose certain part of the market as panel output keeps increasing, but they don't have the next generation of inverter yet to support them. I can bet that if and when they finally have it, those numbers will come down (or de-emphasized), so they can sell the newer models at higher price/margin.16xLG300N1C+SE6000[url]http://tiny.cc/ojmxyx[/url]Comment
-
It might be clipping but from my experience that admittedly suspicious looking plateau isn't that unusual.
Same date, 04/09/2015, my array put out about 8,036 Wh between 12:09 P.D.T. and 13:54 P.D.T. Max. RATE was 4,590 W. MIN. rate was 4,470 W. Fouling at this time is running around 5 % or so.
The P.O.A. irradiance for the same period as estimated from recorded global horizontal irradiance at the array varied between 954 W/m^2 to 982 W/m^2 corrected for pyranometer temp.. Max. P.O.A. occurred at 12:59 P.D.T.
Under a clear sky, things don't change much for about an hour or so on either side of min. incidence angle, which for me occurred at about 13:10 P.D.T. Output usually rolls off a bit sooner in the afternoon which I believe MAY be due to the gradual increase in the temp. of the roof tiles under the array (thermal "lag" of the concrete tiles being the culprit here) which would tend to decrease the radiant heat loss from the underside of the panels, resulting in a slight but I believe noticeable decrease in system efficiency.
So, the plateau on Bob's graph, while it could be due to clipping, may have other, or additional causes. Sometimes things may not be as simple as they appear.Comment
-
Heres my first TOU-D-T statement, and how it all shook out. I also included 3 snapshots , Total use, Peak, and Off Peak.
Hope it sheds some light on how you can save money, combining solar generation, with TOU billing.
solar75.JPGsolar72.JPGsolar73.JPGsolar74.JPGComment
-
I'm trying to decipher that now.... My generation is split between Off peak, and On peak hours. I need to go back, and separate it ...day by day.Comment
-
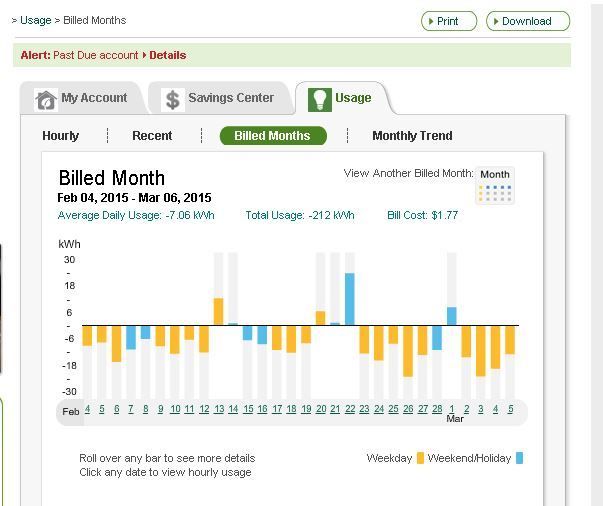
This first snap is for Feb, 2015. "Domestic" billing -7 Kwh's daily usage, -212 surplus at months end. A $32 credit was applied to my account as a result. Disregard the $1.77 number. Thats the SCE flat rate, to use their wires, and generate a bill.
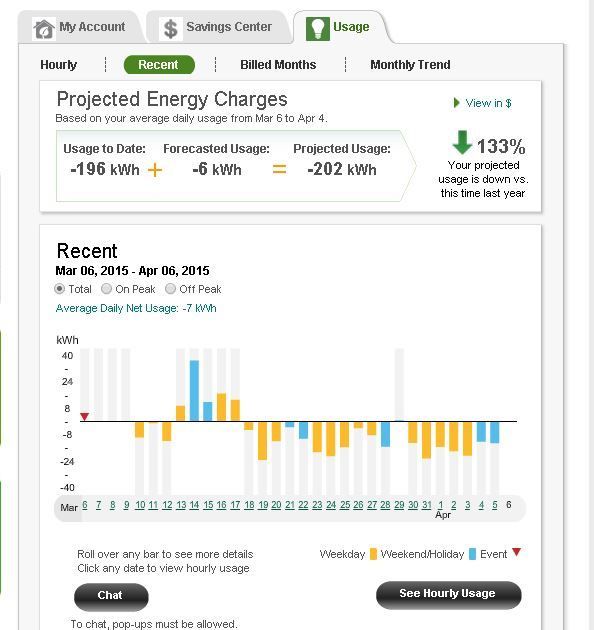

These two snaps for March, 2015. "TOU-D-T " Billing.( one is shown in $$$, the other in KWh's, but its for the same period) Nearly identical numbers. - 7 KwH's daily usage, -202 surplus at months end... BUT.. a $89 credit due to the way "On Peak" generation pricing of $0.22 per KWh and off peak consumption priced at $0.13 a KWh are calculated.
Also , note on the March statement that there was a one time $29 SCE credit for some kind of "Climate Change" program.
solar76.JPG
So, $89 - the $29 Climate credit = a true $ 60 generation credit for March, vs. $32 credit for Feb.
It appears the TOU-D-T increased my billable production by about 100%Comment
-
Thanks for the update. My TOU-D-A statement will be end in few days and this might be a good comparison:
I have generated -346kWH at peak, -427kWh at off peak and use 587kWh during super off peak. the calculation as:
-346kWh X $0.36 = -$124.56 Peak Rate
-427kWh X $0.26 = -$111.02 Off Peak Rate
587kWh X $0.11 = $64.57 Super Off Peak Rate
As you see, I have generated -186kWh but I am getting -$171 credit toward next billing cycle. (The picture show I'm getting -$174 is because my first 2 day still under TOU-D-EV plan were peak start from 12 to 6). The actual credit I'm getting at end of billing cycle has to subtract $0.1/kWh baseline credit generated. For example:
-$171 + basline allocation credit ($0.1 X 186kWh generated = $18.6) = -$152.40
Since I have surplus on my solar, the baseline allocation credit becomes a debit to my account instead of credit.Comment
-
You need to pay POCO for any balance on your last statement. If you have credit on your account, the credit balance will be reset to $0.
For your net surpluse (if you do) POCO pay you almost $0.05/kWh. For TOU users, you might have credit balance on your account, but not necessary you are getting any money from POCO. For example: You might have -$200 balance at true-up but you consumed 1300kWh from POCO and you only generated 1200kWh to POCO.Comment

 Tweet
Tweet


Comment