IV Curve with MPPT Charge Controller

Collapse
X
 
  • Time
  • Show
Clear All
new posts
  • BackwoodsEE
    Solar Fanatic
    • Jun 2017
    • 217

    #46
    The battery is charging fast (probably too fast for its long-term health, but this is an experimental setup), and now is taking about 100 W less from the CC.

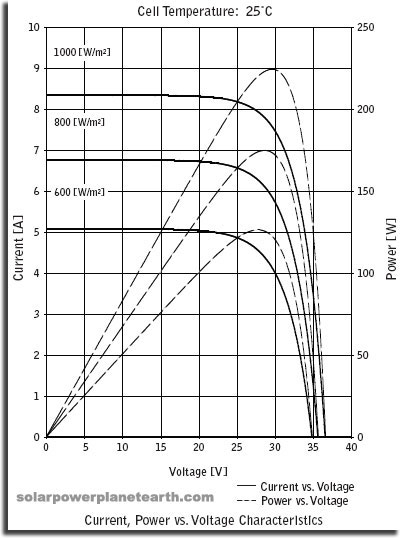
    sensij this is not quite the plot you were looking for showing the CC operating in absorb stage, but it's getting there. You can see how the CC slides down the IV curve more toward Voc to take less power than is available from the PV array (which is now in full sun, as with the previous plot).

    Capture.PNG

    Another interesting little tidbit: Notice how Voc has moved down slightly (green vs. dashed pink plot). It's warming up fast outside, heading for a 95 degree day here, and the panels are heating up even faster now that they're in full sun.

    Comment

    • Sunking
      Solar Fanatic
      • Feb 2010
      • 23301

      #47
      Originally posted by BackwoodsEE
      Now going full tilt with the battery still about half discharged plus about 150 W on the inverter. The last two times it updated MPPT, the CC didn't bother with a full sweep, just a quick look above the input voltage it's currently operating at, up to Voc.
      That means you are not in Bulk Mode, it is in PWM Mode. If you look at any IV Curve on any panel take note what happens to current between Vmp and Voc. Current and power is falling off a cliff.

      A PWM Controller operates from Battery voltage to Voc. Max Power on a PWM Controller occurs at Battery Voltage or 100% Duty Cycle. Essentially panels are connected directly to the battery.

      MPPT Controllers operate at Vmp and Voc. Max power of course is at Vmp, and no Power at Voc. So when A MPPT controller reaches Absorb voltage, the panel voltage goes up from Vmp to reduce current until it reaches Voc at which point there is no Current or Power. So if you are seeing panel voltage go above Vmp, you know it is not producing full power. It is tapering off current because it thinks the battery is charged up. That is what happens when you use to high of a Charge Current.

      That is what I have been trying to tell you and Senji. Hopefully at least you are listening and understanding. That is why I said you want to Clamp the output voltage of a MPPT to 10 to 12.6 volts regardless of how much current you are pushing.

      Last edited by Sunking; 07-08-2017, 04:32 PM.
      MSEE, PE

      Comment

      • BackwoodsEE
        Solar Fanatic
        • Jun 2017
        • 217

        #48
        Now in absorb mode with maybe 150 W of inverter load. There are a few spots of shading on the panels that the CC is trying to work around, and it's making these little updates several times per minute. Operating voltage is moving between 70-95 V, sometimes above MPPT voltage and and sometimes below it. Because of the two shading spots (tips of tree branches each covering 1-2 panel substrings), the MPPT voltage revealed by each IV sweep is a local maximum and there may be a higher one below this. (Kind of wish I had my switched-capacitor box hooked up right now to find out.)

        But the CC doesn't care because it's meeting the load demands of the absorption charge and the modest inverter load.
        Capture.PNG
        Last edited by BackwoodsEE; 07-08-2017, 05:14 PM.

        Comment

        • sensij
          Solar Fanatic
          • Sep 2014
          • 5074

          #49

          Ok, so that is what it looks like when it is controlling in absorb mode. It is nice to see that it isn't PWM, but it has just changed the switching duty cycle to add a little more impedance. It is really interesting the way it runs the sweeps relatively quickly, and then climbs back to whatever point it wants to run at. In bulk mode, that climb happens rapidly with some overshoot, while in absorb it is slower with some dither. Suggests some kind of PI or PID control on the switching duty?

          Are you also capturing slower data over longer time periods too? The transition from bulk to absorb on a longer running VT or IT chart should also add some perspective.
          CS6P-260P/SE3000 - http://tiny.cc/ed5ozx

          Comment

          • BackwoodsEE
            Solar Fanatic
            • Jun 2017
            • 217

            #50
            Originally posted by sensij
            Ok, so that is what it looks like when it is controlling in absorb mode. It is nice to see that it isn't PWM, but it has just changed the switching duty cycle to add a little more impedance. It is really interesting the way it runs the sweeps relatively quickly, and then climbs back to whatever point it wants to run at. In bulk mode, that climb happens rapidly with some overshoot, while in absorb it is slower with some dither. Suggests some kind of PI or PID control on the switching duty?
            I don't think the way it does the sweep is necessarily tied to the battery charging phase. Just now, with late afternoon shading, the CC is struggling to pull enough out of the array even to continue absorption charging, and it did a full 1-second sweep from Vbatt to Voc. I get the feeling its decision to do a full sweep is related to how complex the last-measured IV curve is. When the CC thinks it's operating in full sun with a simple IV curve, I suspect it just tweaks the I/V slightly to keep things optimized.

            Originally posted by sensij
            Are you also capturing slower data over longer time periods too? The transition from bulk to absorb on a longer running VT or IT chart should also add some perspective.
            That would be a cool feature to add. I don't have such long-term plots, but have observed the CC travel along an IV curve for a long time (at least a half hour, maybe longer) without updating it.

            This plot shows how it responded to changes in inverter load well into the absorb phase this afternoon, for at least a half hour without doing an MPPT sweep. The dots are real-time updates to the voltage/current measurements, added to the plot every second or so, and the labels at the right show the latest IV pair yielding 103 W. Without doing a full sweep to update a curve that indicated there was up to 437 W available from the PV array, the CC supplied a 3:1 range of inverter load plus a small amount of absorption charging current. (It never reaches float because I hit this poor battery so hard at night.)
            reduced-load.png

            By the way, I think that "dither" you've noticed is actually 120 Hz from the inverter current draw, aliased to what looks like a lower frequency in the time-domain plot. The PV panels and CC will supply the slight variations in current even at 120 Hz, by lowering the voltage as current increases. The ripple goes away when I shut off the inverter. I have a 47000 uF 16 V capacitor across the battery to reduce the ripple and smooth out the plots.
            Last edited by BackwoodsEE; 07-08-2017, 08:26 PM.

            Comment

            • karrak
              Junior Member
              • May 2015
              • 528

              #51
              Thanks for the plots, very interesting, may I ask what plotting program you are using.

              That is the first time I have seen a plot with the multiple power peaks.

              I use two different control algorithms for my MPPT controller, one when the output voltage is below the programmed output voltage and one when the output voltage has reached the programmed voltage. I would be surprised if the commercial units don't do something similar.

              When the solar panels cannot supply enough power for all the loads attached to the MPPT controller so that the MPPT output voltage is below the programmed voltage or to put it in impedance terms, when the load impedance which is a combination of the battery impedance, and the impedance from any other loads attached to the MPPT output is too low for the MPPT controller output voltage to reach the programmed output voltage the controller uses the power supplied by the panel (in my case it is panel as I have one panel connected to a one of a number of individual buck circuits) to control the on time of the buck circuit to control the amount of power transfered from the panel to the load.

              When the solar panels can supply more than enough power for all the loads, i.e. the load impedance is high enough for the controller output to reach the programed output the on time of the buck circuit and thus the output power from the controller is regulated by the output voltage to keep the controller output at the programmed voltage. As sensij has already stated the output is not a PWM pulse train, it is a variable current constant DC voltage output. By the way, it is good to see that sensij is still posting here.

              When the controller is in MPPT mode the control loop software that controls the amount of power being drawn from the panel will keep trying to increase the panel voltage. The software then checks to see if the increase results in more power, if so it will increase the voltage again. If the increased voltage results in a decrease in power the software will decrease the voltage. As jflorey2 has already stated, this is know as perturb and observe.

              I would think the best overall algorithm when in MPPT mode would be perturb and observe with occasional sweeps to see if there is more than one power peak and if there is to move the perturb and observe voltage point to the new maximum power peak. I don't do the sweeps as I doubt I would every have more than one power peak with my setup of individual panels. Any thoughts?


              Simon

              Off grid 24V system, 6x190W Solar Panels, 32x90ah Winston LiFeYPO4 batteries installed April 2013
              BMS - Homemade Battery logger github.com/simat/BatteryMonitor
              Latronics 4kW Inverter, homemade MPPT controller
              Off-Grid LFP(LiFePO4) system since April 2013

              Comment

              • BackwoodsEE
                Solar Fanatic
                • Jun 2017
                • 217

                #52
                Originally posted by karrak
                Thanks for the plots, very interesting, may I ask what plotting program you are using.
                It's my own Python code using Matplotlib with the PyQt GUI framework. Implementing those arrow-plus-text labels took a lot more effort than I'd planned on, though it was a fun challenge. They update dynamically with each new plot and each new circle data point added to the plot to avoid overlapping each other, the plot borders, and each other. A lot of geometry involved!

                Originally posted by karrak
                That is the first time I have seen a plot with the multiple power peaks.
                I hadn't either except in one app note from SMA or someone touting the benefits of string inverters over microinverters. I thought it was really cool to actually observe with the plots what happens in practice with shading that I can look outside and see myself.

                Originally posted by karrak
                I use two different control algorithms for my MPPT controller, one when the output voltage is below the programmed output voltage and one when the output voltage has reached the programmed voltage. I would be surprised if the commercial units don't do something similar.

                When the solar panels cannot supply enough power for all the loads attached to the MPPT controller so that the MPPT output voltage is below the programmed voltage or to put it in impedance terms, when the load impedance which is a combination of the battery impedance, and the impedance from any other loads attached to the MPPT output is too low for the MPPT controller output voltage to reach the programmed output voltage the controller uses the power supplied by the panel (in my case it is panel as I have one panel connected to a one of a number of individual buck circuits) to control the on time of the buck circuit to control the amount of power transfered from the panel to the load.

                When the solar panels can supply more than enough power for all the loads, i.e. the load impedance is high enough for the controller output to reach the programed output the on time of the buck circuit and thus the output power from the controller is regulated by the output voltage to keep the controller output at the programmed voltage. As sensij has already stated the output is not a PWM pulse train, it is a variable current constant DC voltage output. By the way, it is good to see that sensij is still posting here.

                When the controller is in MPPT mode the control loop software that controls the amount of power being drawn from the panel will keep trying to increase the panel voltage. The software then checks to see if the increase results in more power, if so it will increase the voltage again. If the increased voltage results in a decrease in power the software will decrease the voltage. As jflorey2 has already stated, this is know as perturb and observe.
                Very cool that you've built your own MPPT charge controller! I'd love to know more--buck converter? Synchronous MOSFTET or diode? What is doing the control logic?

                Originally posted by karrak
                I would think the best overall algorithm when in MPPT mode would be perturb and observe with occasional sweeps to see if there is more than one power peak and if there is to move the perturb and observe voltage point to the new maximum power peak. I don't do the sweeps as I doubt I would every have more than one power peak with my setup of individual panels. Any thoughts?
                I think that's exactly what Morningstar is doing in my TS-MPPT-60.

                Now, for another pretty picture: Here it is working hard in full morning sun with a heavily discharged battery and about 150 W of inverter loads. The panels put out about 8.5 A max, but the sun is at a significant angle to them right now.

                Capture.PNG

                Comment

                • inetdog
                  Super Moderator
                  • May 2012
                  • 9909

                  #53
                  Depending on how the MPPT elements are tweaked to limit the input power, the voltage operating point of the CC input when the battery cannot sink full CC current could be either above Vmp, approaching Voc when no power is needed (higher voltage but lower current, so lower power) or below Vmp, approaching 0V (lower voltage but limited current, so lower power.)
                  I don't have any concrete information on which way particular CCs choose to go.

                  If they are just pulse width modulating the MPP input condition, on and off, the average string voltage you see will necessarily be above Vmp.
                  SunnyBoy 3000 US, 18 BP Solar 175B panels.

                  Comment

                  • karrak
                    Junior Member
                    • May 2015
                    • 528

                    #54
                    Originally posted by BackwoodsEE
                    It's my own Python code using Matplotlib with the PyQt GUI framework. Implementing those arrow-plus-text labels took a lot more effort than I'd planned on, though it was a fun challenge. They update dynamically with each new plot and each new circle data point added to the plot to avoid overlapping each other, the plot borders, and each other. A lot of geometry involved!
                    Ah, another python coder. I am new to python, my first and only project to date being my BMS. Sadly, FORTH which I have coded in for most of my professional career is almost dead so I have had to change languages. I do things slightly different to you. I tend to log the data as ASCII data and use gnuplot or a spreadsheet program to plot at a later date. I do like those arrow-plus-text labels, will have to check if gnuplot can do it.

                    Very cool that you've built your own MPPT charge controller! I'd love to know more--buck converter? Synchronous MOSFTET or diode? What is doing the control logic?
                    It is not exactly rocket science, yes I have multiple buck circuits, one for each panel and am being slack and using diodes rather than MOSFETs for the flyback circuit. The control circuit is a general purpose Motorola/Freescale 68HC12 microprocessor based PCB that I knocked up a while ago for all my little projects. Software is machine code and FORTH. Here is an outline schematic of the power section of the controller.
                    SolarControllerPower.jpg


                    Simon

                    Off grid 24V system, 6x190W Solar Panels, 32x90ah Winston LiFeYPO4 batteries installed April 2013
                    BMS - Homemade Battery logger github.com/simat/BatteryMonitor
                    Latronics 4kW Inverter, homemade MPPT controller


                    Attached Files
                    Off-Grid LFP(LiFePO4) system since April 2013

                    Comment

                    • inetdog
                      Super Moderator
                      • May 2012
                      • 9909

                      #55
                      Originally posted by karrak
                      Ah, another python coder. I am new to python, my first and only project to date being my BMS. Sadly, FORTH which I have coded in for most of my professional career is almost dead so I have had to change languages. I do things slightly different to you. I tend to log the data as ASCII data and use gnuplot or a spreadsheet program to plot at a later date. I do like those arrow-plus-text labels, will have to check if gnuplot can do it.
                      Bumper sticker, many years ago:

                      "You FORTH love if honk then"

                      SunnyBoy 3000 US, 18 BP Solar 175B panels.

                      Comment

                      • BackwoodsEE
                        Solar Fanatic
                        • Jun 2017
                        • 217

                        #56
                        Very cool, Simon. If it's any consolation about your FORTH experience, I coded an embarrassing amount of stuff in TCL/TK about 20 years ago. Before that, in BASIC. And in my youth, assembly language for the 6502 and 6800 8-bit processors. I only recently learned C++, and used it to program the Teensy 3.2 controller in my device to do the data acquisition (including some bit-banging to talk with the A/D converter via SPI), Lagrange interpolation, and Ethernet communication.
                        This morning I have an interesting current-vs-voltage (IV) curve from my string of three PV panels with shade from some trees to the east. Again, the green line shows the IV curve from the last time the charge controller swept the array voltage (and thus current) and the dashed pink line shows the one previously obtained from the charge controller.
                        Note how the voltage for a given amount of current flow from the solar array has increased by about 10V from the previous sweep. That's because enough sun finally hit a substring of PV cells within a panel (there are three substrings in each) to get the PV cells to conduct the current rather than having it go through the substring's bypass diodes.

                        The panels haven't warmed up yet (thankfully, it still cools off nicely here at night) and Voc is up to around 107 V.

                        Capture.PNG

                        Comment

                        • karrak
                          Junior Member
                          • May 2015
                          • 528

                          #57
                          Have you noticed if the MPPT controller does a sweep if the sun goes quickly from clear sky to behind a thick cumulus or cumulonimbus type of cloud and the sun's intensity drops suddenly?

                          Simon
                          Off-Grid LFP(LiFePO4) system since April 2013

                          Comment

                          • karrak
                            Junior Member
                            • May 2015
                            • 528

                            #58
                            Originally posted by inetdog

                            Bumper sticker, many years ago:

                            "You FORTH love if honk then"
                            I it like ! .

                            After this comment there maybe a few readers scratching their heads. A few others might think that this confirms that I have a screw loose. Maybe I am not the only one ...

                            Simon
                            Off-Grid LFP(LiFePO4) system since April 2013

                            Comment

                            • BackwoodsEE
                              Solar Fanatic
                              • Jun 2017
                              • 217

                              #59
                              I continue to be impressed at how well the Morningstar TS-MPPT-150 tracks the maximum power point of the 3-panel string in my experimental system. Here there is just a small amount of sun peeking over the trees and the charge controller has accurately picked the very best voltage and current to draw power with, even though that voltage is quite low.

                              IMG_2213.PNG

                              Comment

                              • AzRoute66
                                Solar Fanatic
                                • Jul 2017
                                • 446

                                #60
                                I love this thread. I always go to the plots first then guess what the discussion will be. Not doing as well as I would have hoped. Once I read the discussion I go back to the plots and say 'of course it is'. I'm glad I do not have access to this testbed. I would sit and stare at it like a little kid watching Saturday cartoons. I can't imagine how many things I would stick out the window to produce controlled partial shade. Light from the window? Full moon? Yee-haw.

                                Comment

                                Working...